Visualization Weekly Viral Load from Hub Labs
As a Data Analyst, I thoroughly enjoy utilizing Python, R, SQL, Excel, and data visualization tools such as Power BI and Tableau. Feel free to connect with me on Linkedin to learn more about my professional background, and don't forget to check out my tweets on Twitter.

In this project, I used Python to build an ETL pipeline to get data from excel into postgres and use SQL for analysis

In this project, I exracted data from kobotoolbox using api in R and analyze then push it to PowerBI.

In this project, a Covid-19 database was queried and analyzed using SQL Server. Insights like the continents and countries with the highest recorded cases and deaths were derived.

Parch and Posey is an e-commerce paper selling company that sold 3 diffetrent types of papers to companies(accounts) via different channels at diferent point in time in different regions.

The CMO of VarnArsdel, a fictitious manufacturing company wanted to keep an eye on the company's performance both internally and externally. As the Business Intelligence Analyst, I analyzed the sales and market share data of the company and its competitors and built an interactive Excel dashboard answering the relevant business questions.

The majority of stakeholders' concerns center on insights, and it has been demonstrated that insights are easier to comprehend with images than with figures. Because of this, I have done a lot of research on the best chart formats for different audiences and the peculiarity of the insight that needs to be conveyed.
Here are a few dashboards I created using Power BI.
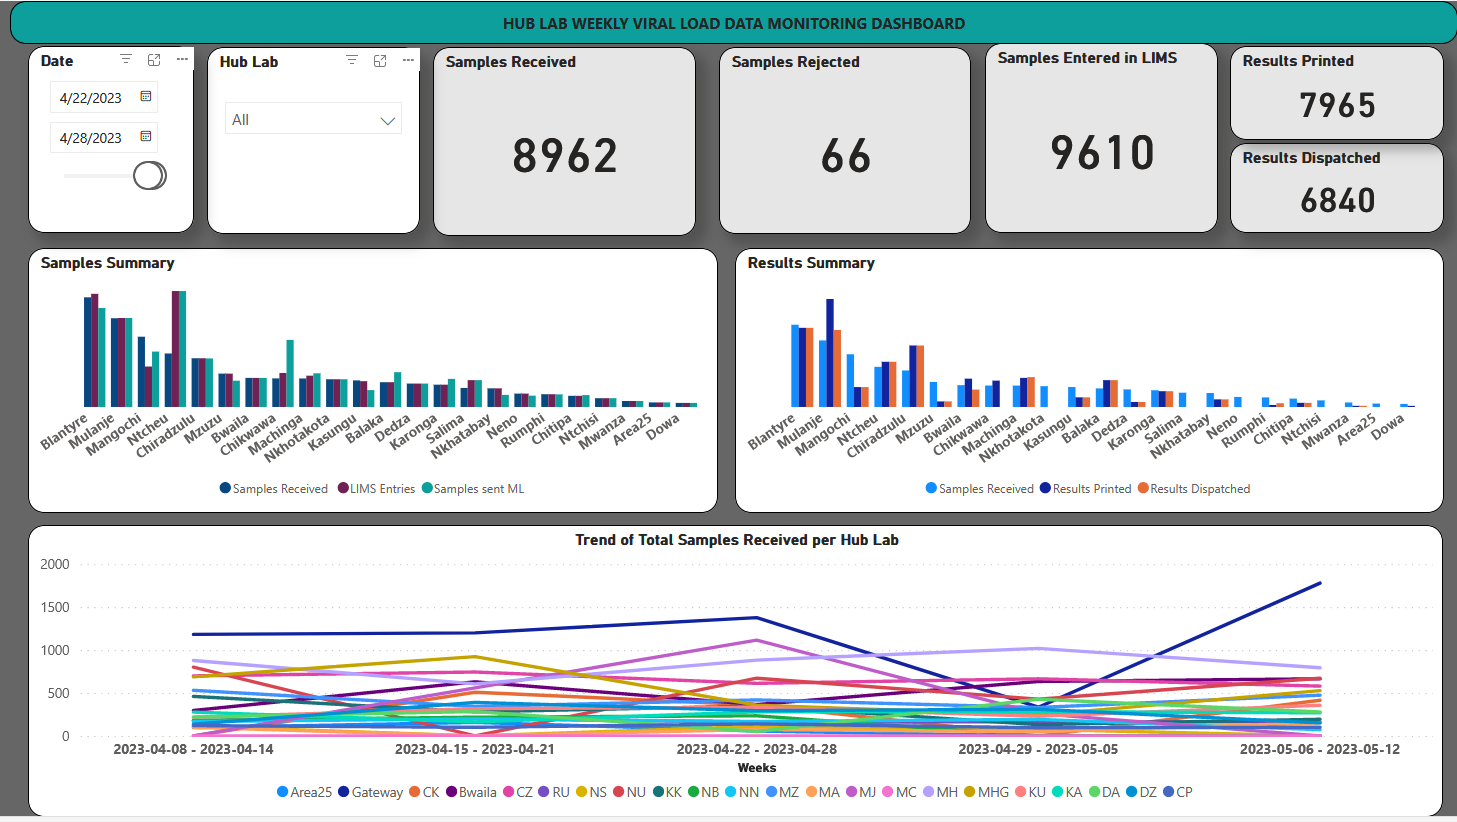
Visualization Weekly Viral Load from Hub Labs
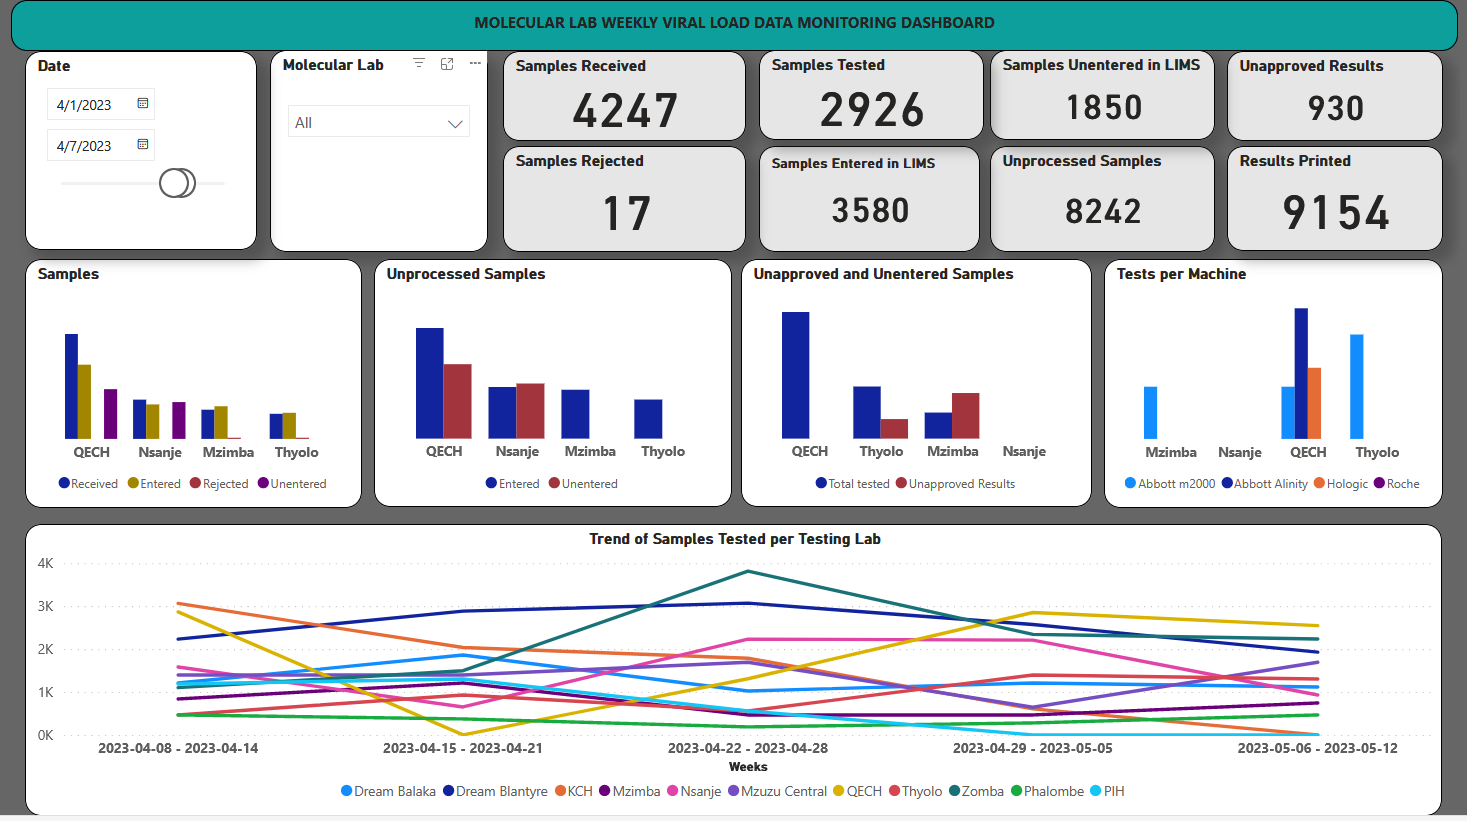
Visualization Weekly Viral Load from Molecular Labs
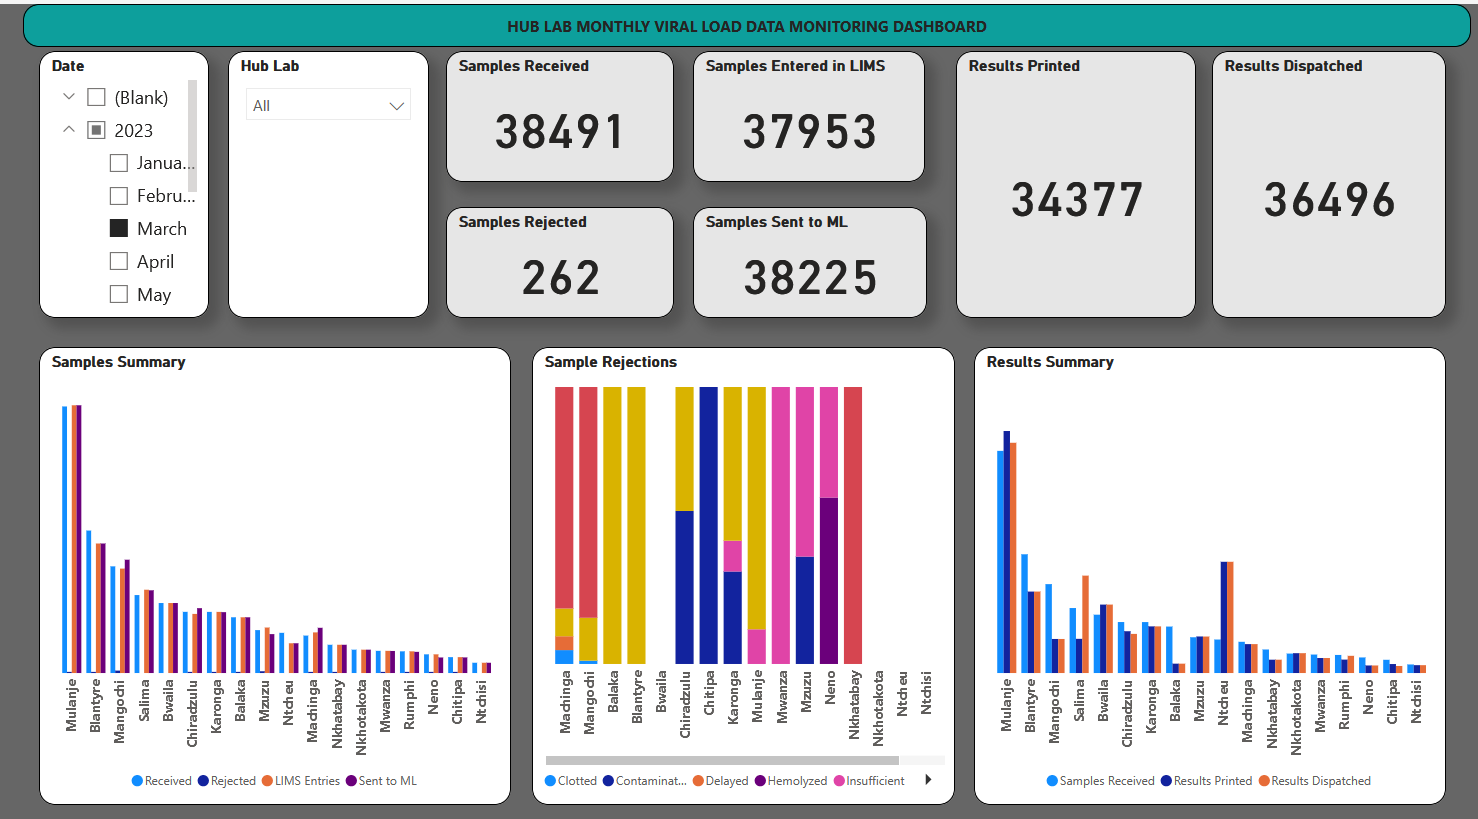
Visualization Monthly Viral Load from Hub Labs
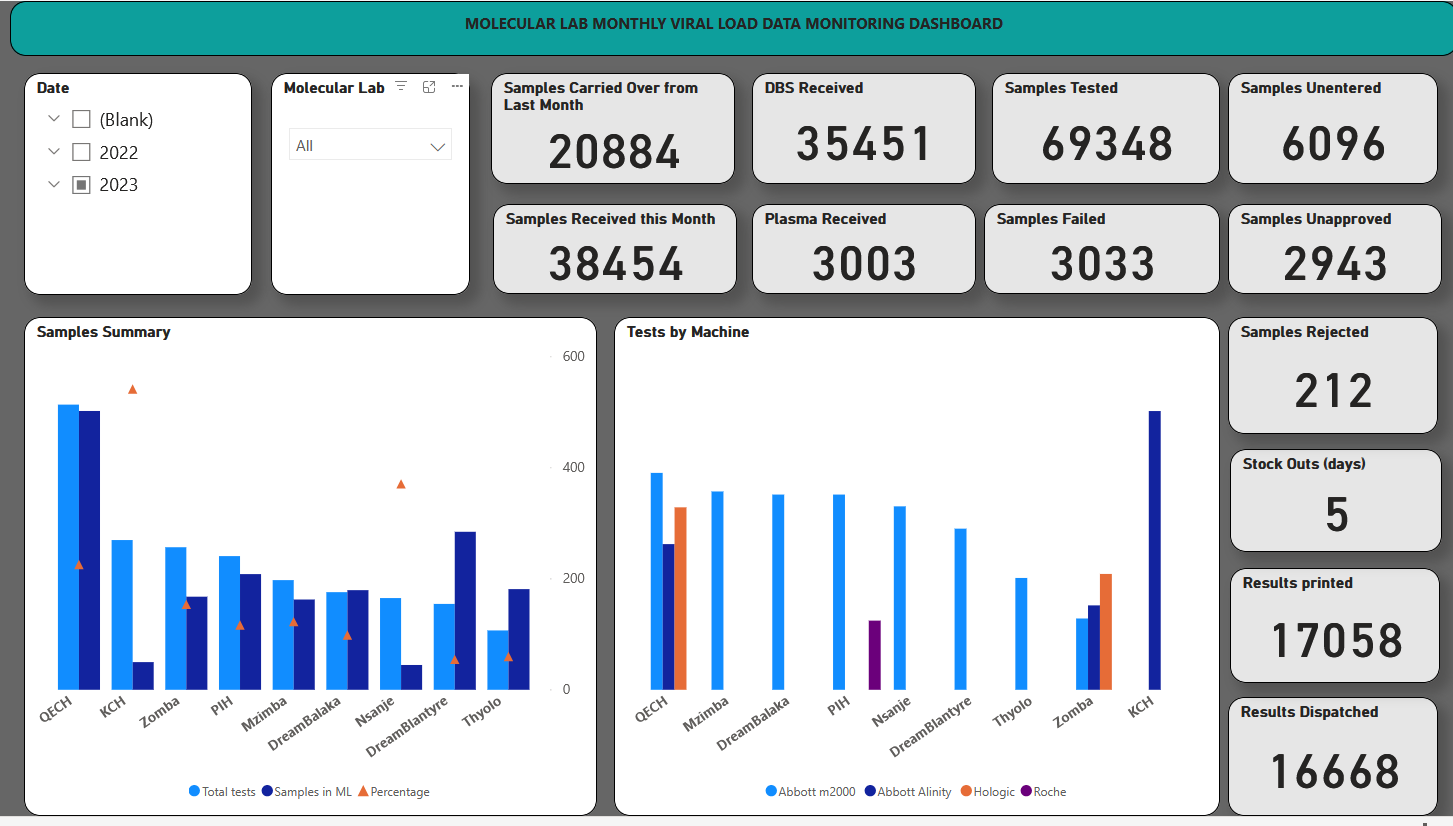
Visualization Monthly Viral Load from Molecular Labs